This number crunch article presents 5 different charts of local market conditions, with a focus on different price ranges. The data used for the article was based on single-family detached homes that were listed for sale or sold in the Greater Albuquerque Market Areas in 2009 and 2010.
Chart 1: Pending Sales by Price (Month vs. Month)
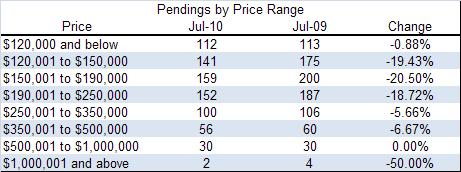
Summary of Chart 1: Overall, July 2010 was a month that saw a 14.06 percent drop in Pending sales from the previous year. Homes priced between $120,000 and $250,000 show the highest decreases.. Properties priced below $120,000 show only a 0.88 percent decrease from the previous year.
Chart 2: New Listings by Price (Month vs. Month)
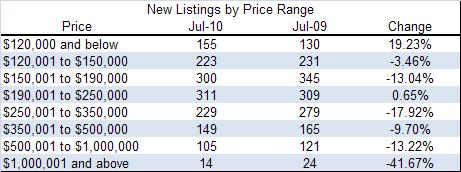
Summary of Chart 2: Overall, the new listing trend for July 2010 shows that there were less new listings entering the market when compared to the previous year. Properties priced below $120,000 saw the highest levels of new listing activity in the month of July.
Chart 3: Days on Market by Price (Month vs. Month)
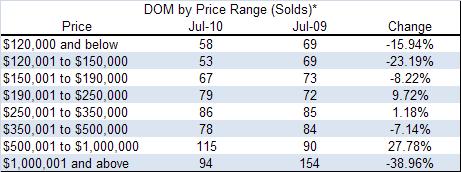
Note: Sold listing information may differ slightly from monthly reports due to late entry of sold listings.
Note: Sold listing information may differ slightly from monthly reports due to late entry of sold listings.
Summary of Chart 3: There are no surprises with the Days on Market for sold listings in July 2009 and 2010. The general trend is that properties that are priced lower go to closing faster. Detached homes that sold for less than $190,000 show the largest decrease in Days on Market when compared to the previous year.
Chart 4: Quarterly Sales by Price (Quarter vs. Quarter)
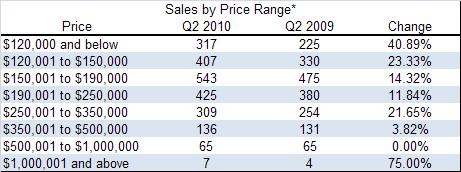
Note: Sold listing information may differ slightly from monthly reports due to late entry of sold listings.
Note: Sold listing information may differ slightly from monthly reports due to late entry of sold listings.
Summary of Chart 4: This chart of 2nd Quarter sales by price shows there were no decreases in sales compared to 2nd Quarter 2009. The largest increases were with homes that sold below $150,000 and between $250,001 and $350,000.
Chart 5: Price Reductions by Price (Summer 2010)
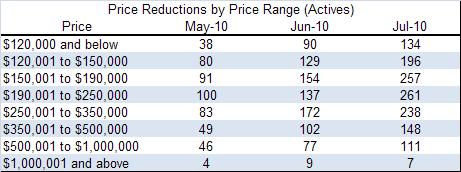
Note: Data for Chart 5 was obtained using the MLS Hotsheet search. Any listings that were Off Market will not generate in the results of the Hotsheet Search when a Price Change is specified.
Summary of Chart 5: Price reductions for May-July were tracked by looking at all listings that had a price change that month, counting the same listing more than once if it’s price changed multiple times in that period. The chart shows a rising trend in the increase of price changes on MLS listings in the summer of 2010.
Information deemed reliable but not guaranteed. Data courtesy of Southwest MLS, Inc.


No comments:
Post a Comment