Showing posts with label market stats. Show all posts
Showing posts with label market stats. Show all posts
Sunday, May 2, 2010
New Mexico March Housing Trend Stats Posted
U.S. House Stats New Mexico March and 2010 First Quarter reports have been posted on nmrealtor.com. The number of single-family home sales in New Mexico in March increased 21.5% from March 2009. The median sales price of a New Mexico home during March 2010 was $171,000. The March median sales price is .6% higher than February’s median of $169,950.


Tuesday, April 6, 2010
New Mexico February Housing Trend Stats
The number of sales is higher for February 2010 from both January 2010 and February 2009, however the median price has dropped to $170,000... Read reports here > nmrealtor.com
Friday, April 2, 2010
Absorption Rates for Greater Albuquerque market areas
This article utilizes Absorption Rate, a key market indicator found in the Monthly Market Reports, to highlight existing single-family housing conditions in the Greater Albuquerque market areas. The data used for this Number Crunch article will be for single family, detached homes that are for sale now and for listings that were reported sold in the last year.
Definition of Terms:
Absorption Rate (AR) – The absorption rate measures how long it will take to exhaust the current housing inventory. An average market is traditionally a six-month supply. The rate is refered to as MSI, Monthly Supply of Inventory.
How SWMLS calculates the Absorption rate:
The absorption rate calculation is the number of active listings divided by the monthly sales average. An example explaining how January’s 7.99 AR was calculated follows.
We’ll start with the Active listings. There were 4,766 Active detached listings for January. This number was obtained from a Feburary 5th data pull. Active listing counts for monthly reports are typically obtained on the 5th day of the following month.
Now for the monthly sales average. In order to determine this average, we need to look at 12 months worth of monthly homes sales, that's 12 sales values divided by 12. The January 2010 sales average was 596.17. Another way of saying it is from January 2009 to January 2010 an average of 596.17 homes sold each month in the Greater ABQ Market. The monthly sales average has been between 573 and 600 for the last twelve months.
The calculation for the January absorption rate is going to be 4,766 / 596.17. It will take 7.99 months to exhaust the current supply of homes for sale.
The absorption rate for detached homes, since May 2008, has stayed between 7.2 and 9.2. A traditional market is considered to have a 6.0 absorption rate.
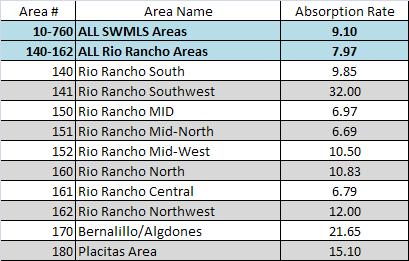
Here is a breakdown of all Active listings for sale SWMLS Areas and they're corresponding Absorption Rates. (as of February 22, 2010)
Absorption Rate (AR) – The absorption rate measures how long it will take to exhaust the current housing inventory. An average market is traditionally a six-month supply. The rate is refered to as MSI, Monthly Supply of Inventory.
How SWMLS calculates the Absorption rate:
The absorption rate calculation is the number of active listings divided by the monthly sales average. An example explaining how January’s 7.99 AR was calculated follows.
We’ll start with the Active listings. There were 4,766 Active detached listings for January. This number was obtained from a Feburary 5th data pull. Active listing counts for monthly reports are typically obtained on the 5th day of the following month.
Now for the monthly sales average. In order to determine this average, we need to look at 12 months worth of monthly homes sales, that's 12 sales values divided by 12. The January 2010 sales average was 596.17. Another way of saying it is from January 2009 to January 2010 an average of 596.17 homes sold each month in the Greater ABQ Market. The monthly sales average has been between 573 and 600 for the last twelve months.
The calculation for the January absorption rate is going to be 4,766 / 596.17. It will take 7.99 months to exhaust the current supply of homes for sale.
The absorption rate for detached homes, since May 2008, has stayed between 7.2 and 9.2. A traditional market is considered to have a 6.0 absorption rate.
Here is a breakdown of all Active listings for sale SWMLS Areas and they're corresponding Absorption Rates. (as of February 22, 2010)
MLS Areas for Bernailillo County and Corrales
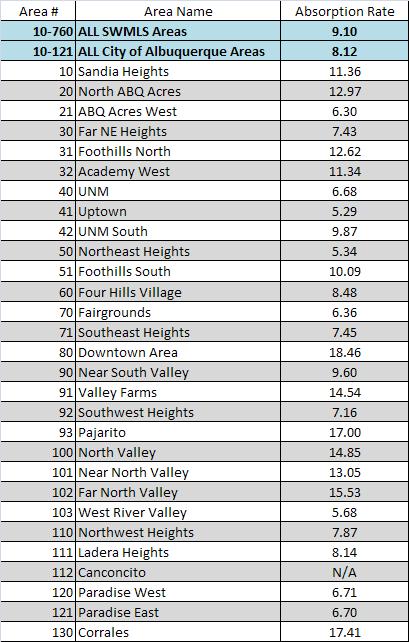
* N/A for Area 112 due to no sales.
**For the Bernalillo County areas the highest AR is in Area 80. This area has averaged around 10 sales a month in the last year (Average MLS area sales are 15) and has an inventory of 180 homes (Average MLS area Active listings is 126).
MLS Areas for East Mountains and Estancia Basin
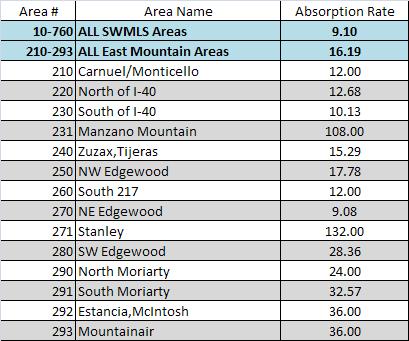
*Areas 231 and 271 show a skewed number, with values over 100 for the months supply of inventory. These values are high due to low sales and a small Active inventory.
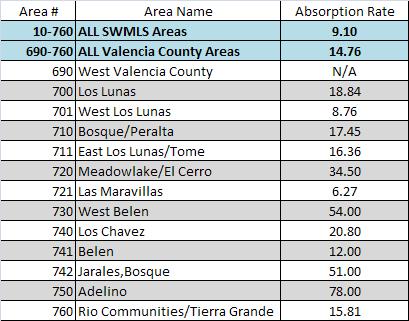
*N/A for Area 690 due to no sales.
Monday, November 9, 2009
Albuquerque Area Spotlights
Looking for information about a particular Albuquerque Area?
GAAR creates and posts Area Spotlight articles that include boundaries, statistics, school information and more.
Click here to view a list of MLS Area Spotlight articles.
Tuesday, January 13, 2009
December 2008 Home Sales Report
For December there were 917 new detached residential listings added to our market. This number is down 18.2% from last month, and down 13.8% from December of last year. New homes on the market tend to decrease in the winter months. Despite the decrease in new listings, the overall market inventory remains over 5,200, only 5% lower than the same period last year. December 2008 shows a combined total of 899 Pending and Closed Sales in the Greater Albuquerque market area. This total is down from last… Continue reading December 2008 Home Sales Report" href="http://www.gaar.com/market_statistics/report/december_2008_home_sales_report1/">Continue reading "December 2008 Home Sales Report"
Subscribe to:
Posts (Atom)


 Posts
Posts


